Here's a small sample of projects that I have carried out:
1. Education attainment & median household income:
Spatial examination of relationship between education attainment and median household income. We can use United States Census data (county shapefile, education attainment, and median household income) to visualize the spatial relationship between education attainment levels (High School graduation>25 years) and median household income levels (25-44 years) using ArcGIS Pro 2.9. It can be observed that there is a distinct geographic pattern that households with higher education attainment tend to exhibit a higher median household income across different counties in USA.
Data source: https://www.census.gov/geographies/mapping-files/time-series/geo/carto-boundary-file.html and https://www.census.gov/topics/education/educational-attainment/data/tables.html
2. climate change and Food security:
One of my research interest focuses on the spatiotemporal examination of climate change on food production and food security.
I used ARIMA (AutoRegressive Integrated Moving Average) model to capture a suite of different standard temporal structures in time series data. I used Eviews 12 to find the fixed parameters for a standard ARIMA(p,d,q), and then simulated the future data. Subsequently, I used ESRI ArcGIS Pro to join the geospatial attribute tables and produce the graduated maps to visualize the likely impact. This is a collaborative project with researchers from College of Agriculture, Biotechnology & Natural Resources at UNR. Data source: https://www.fao.org/faostat/en/#home
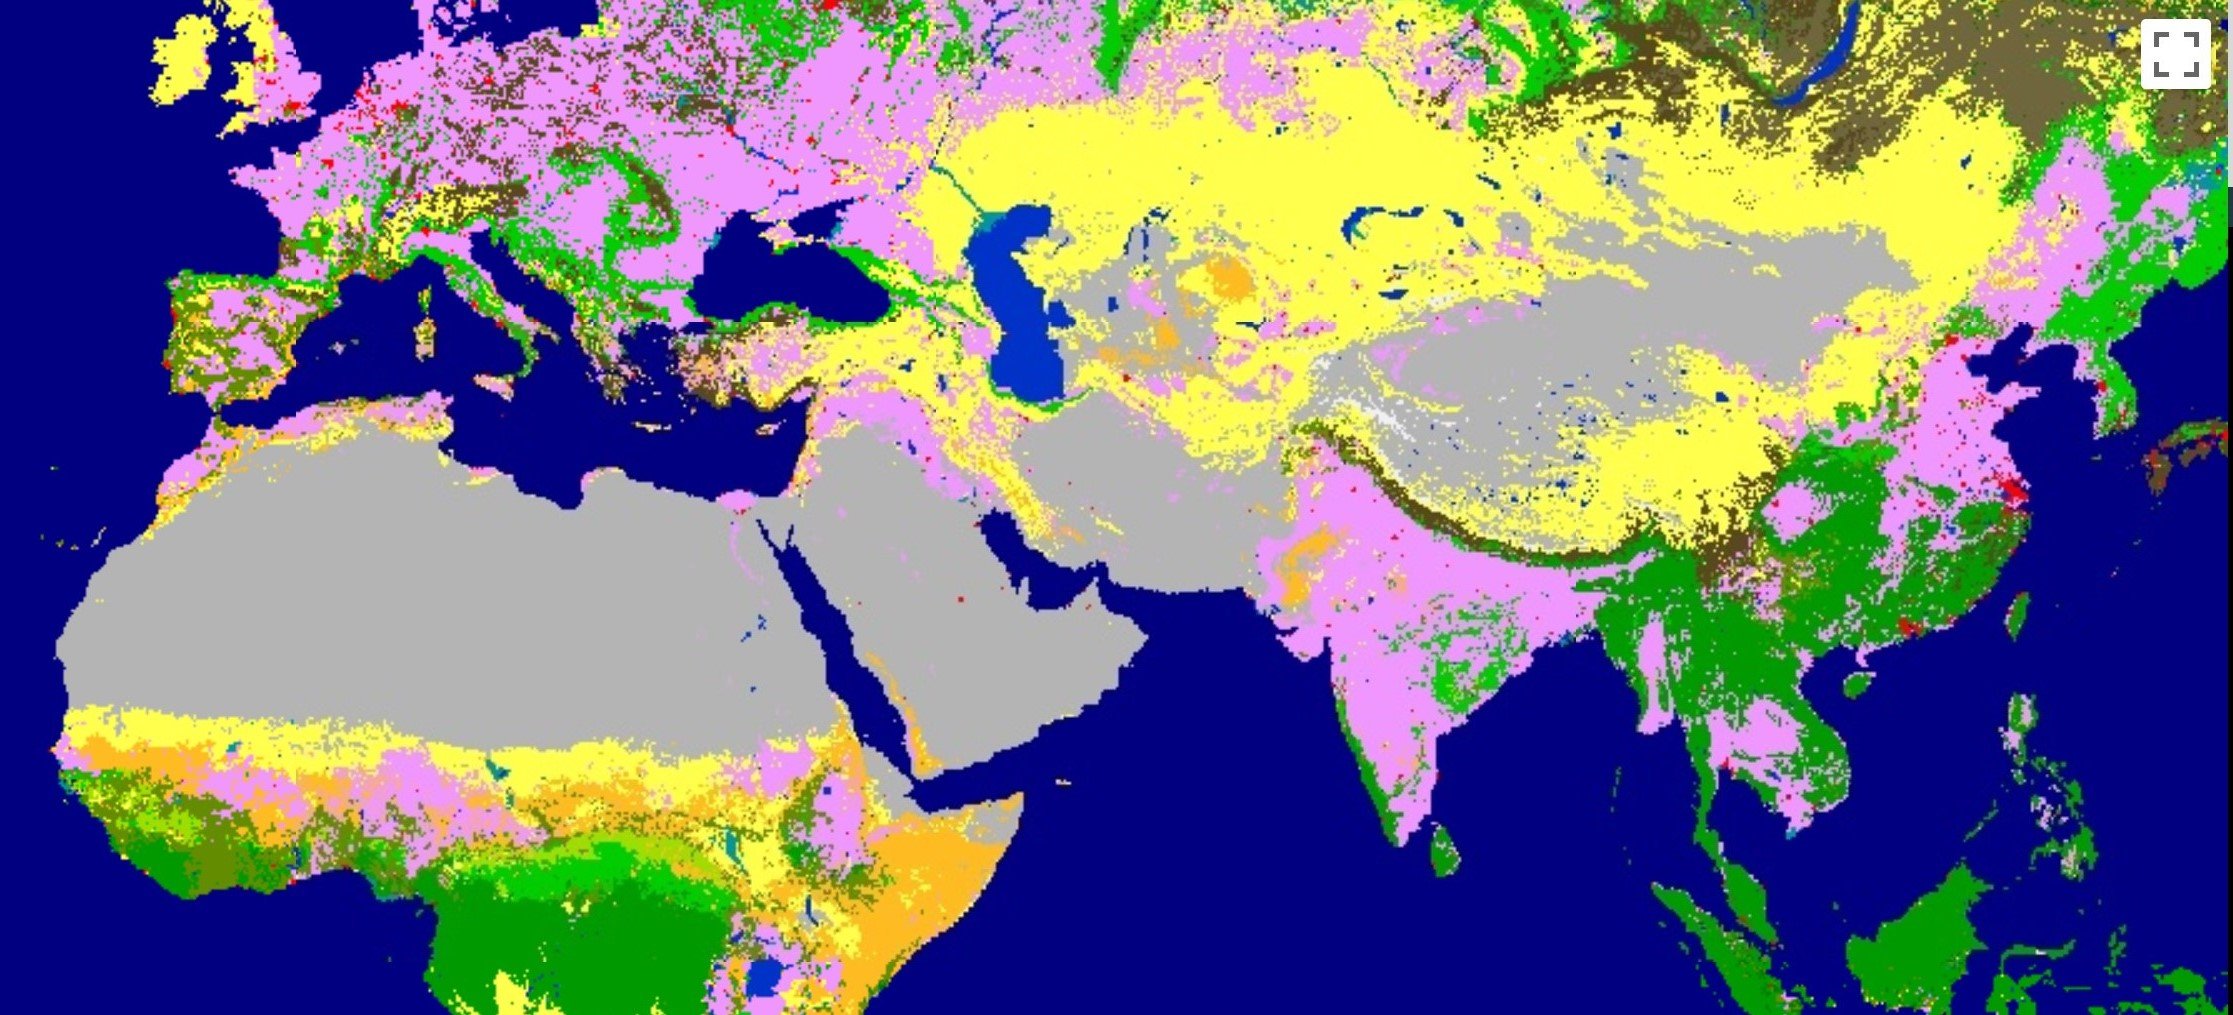
MODIS - Land Use
Geospatial analysis of simulated data on average maize harvest area and production across the globe.
3. Covid-19 progression: python & aRCgis
Another research topic that interests me involves geospatial examination of diseases and epidemic such as hotspot analysis and geographic weighted regression.
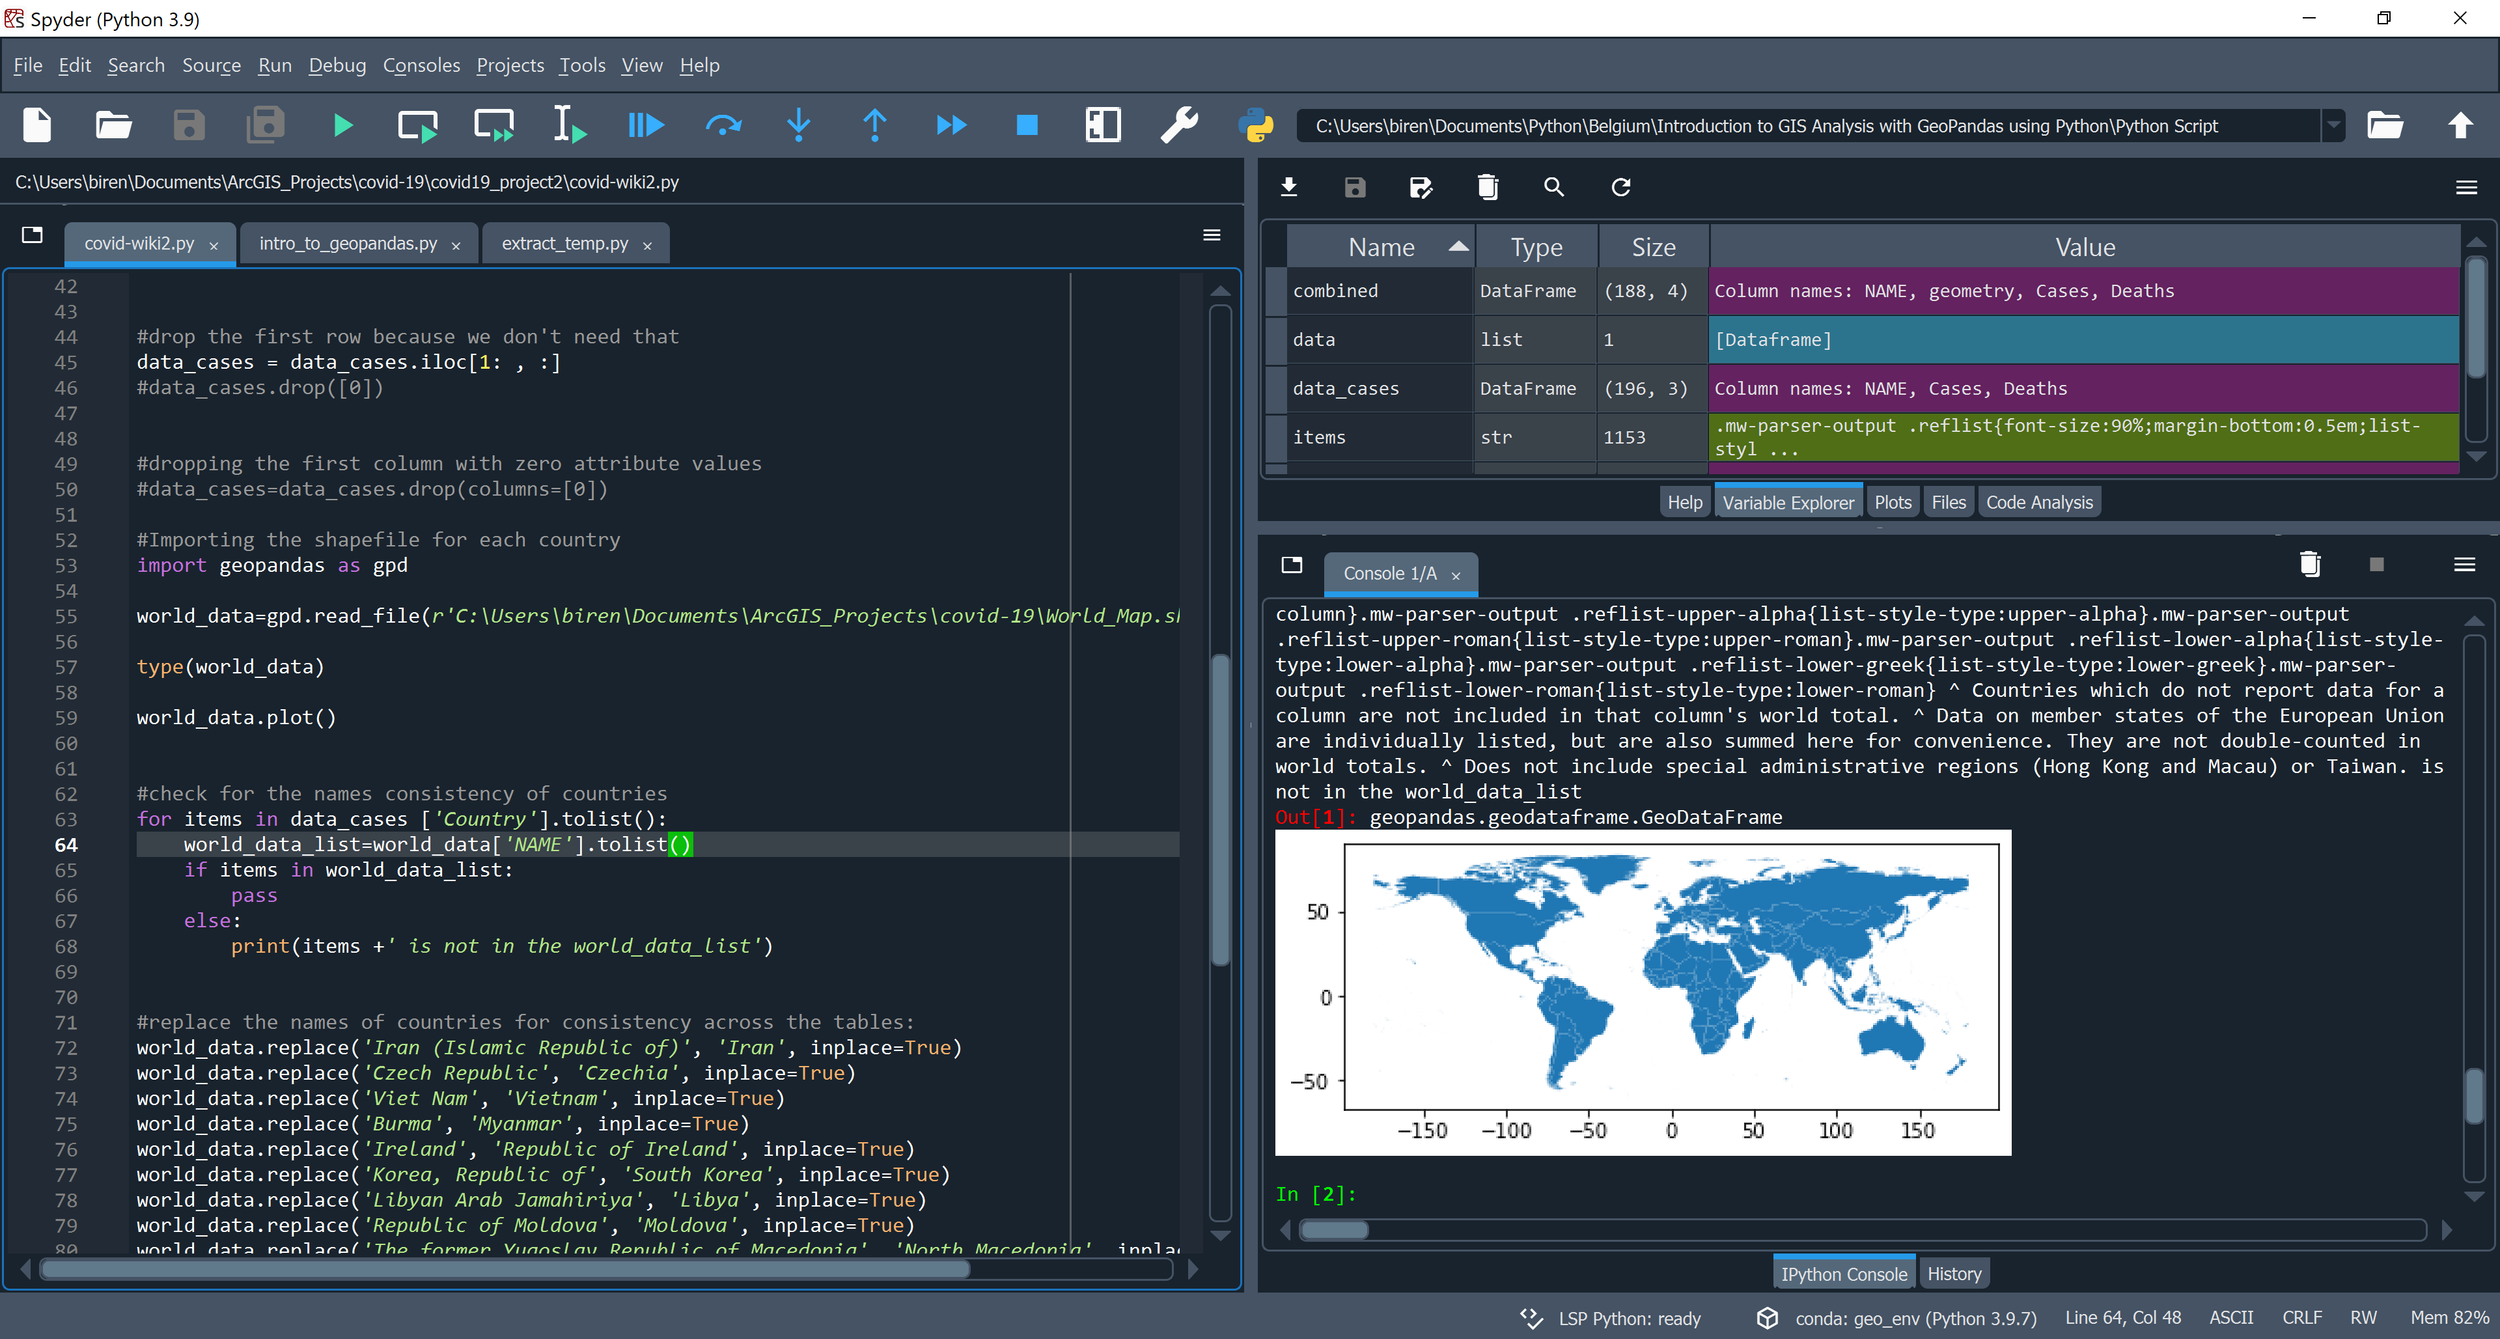
In this project here, I used pandas, geopandas, and matplotlib libraries (Python) to scrape through the real-time data for the country-wise cases of coronavirus cases from John Hopkins Coronavirus Resource Center website. I subsequently cleaned the data and converted it into a suitable geodataframe file. I then imported into ArcGIS Pro for further analysis and visualization. Finally, I created a dynamic COVID mapping using the available time-series.
Geographic distribution of COVID-19 cases using Python and ArcGIS Pro.
4. Tornado initial points in USA (1950-2019)
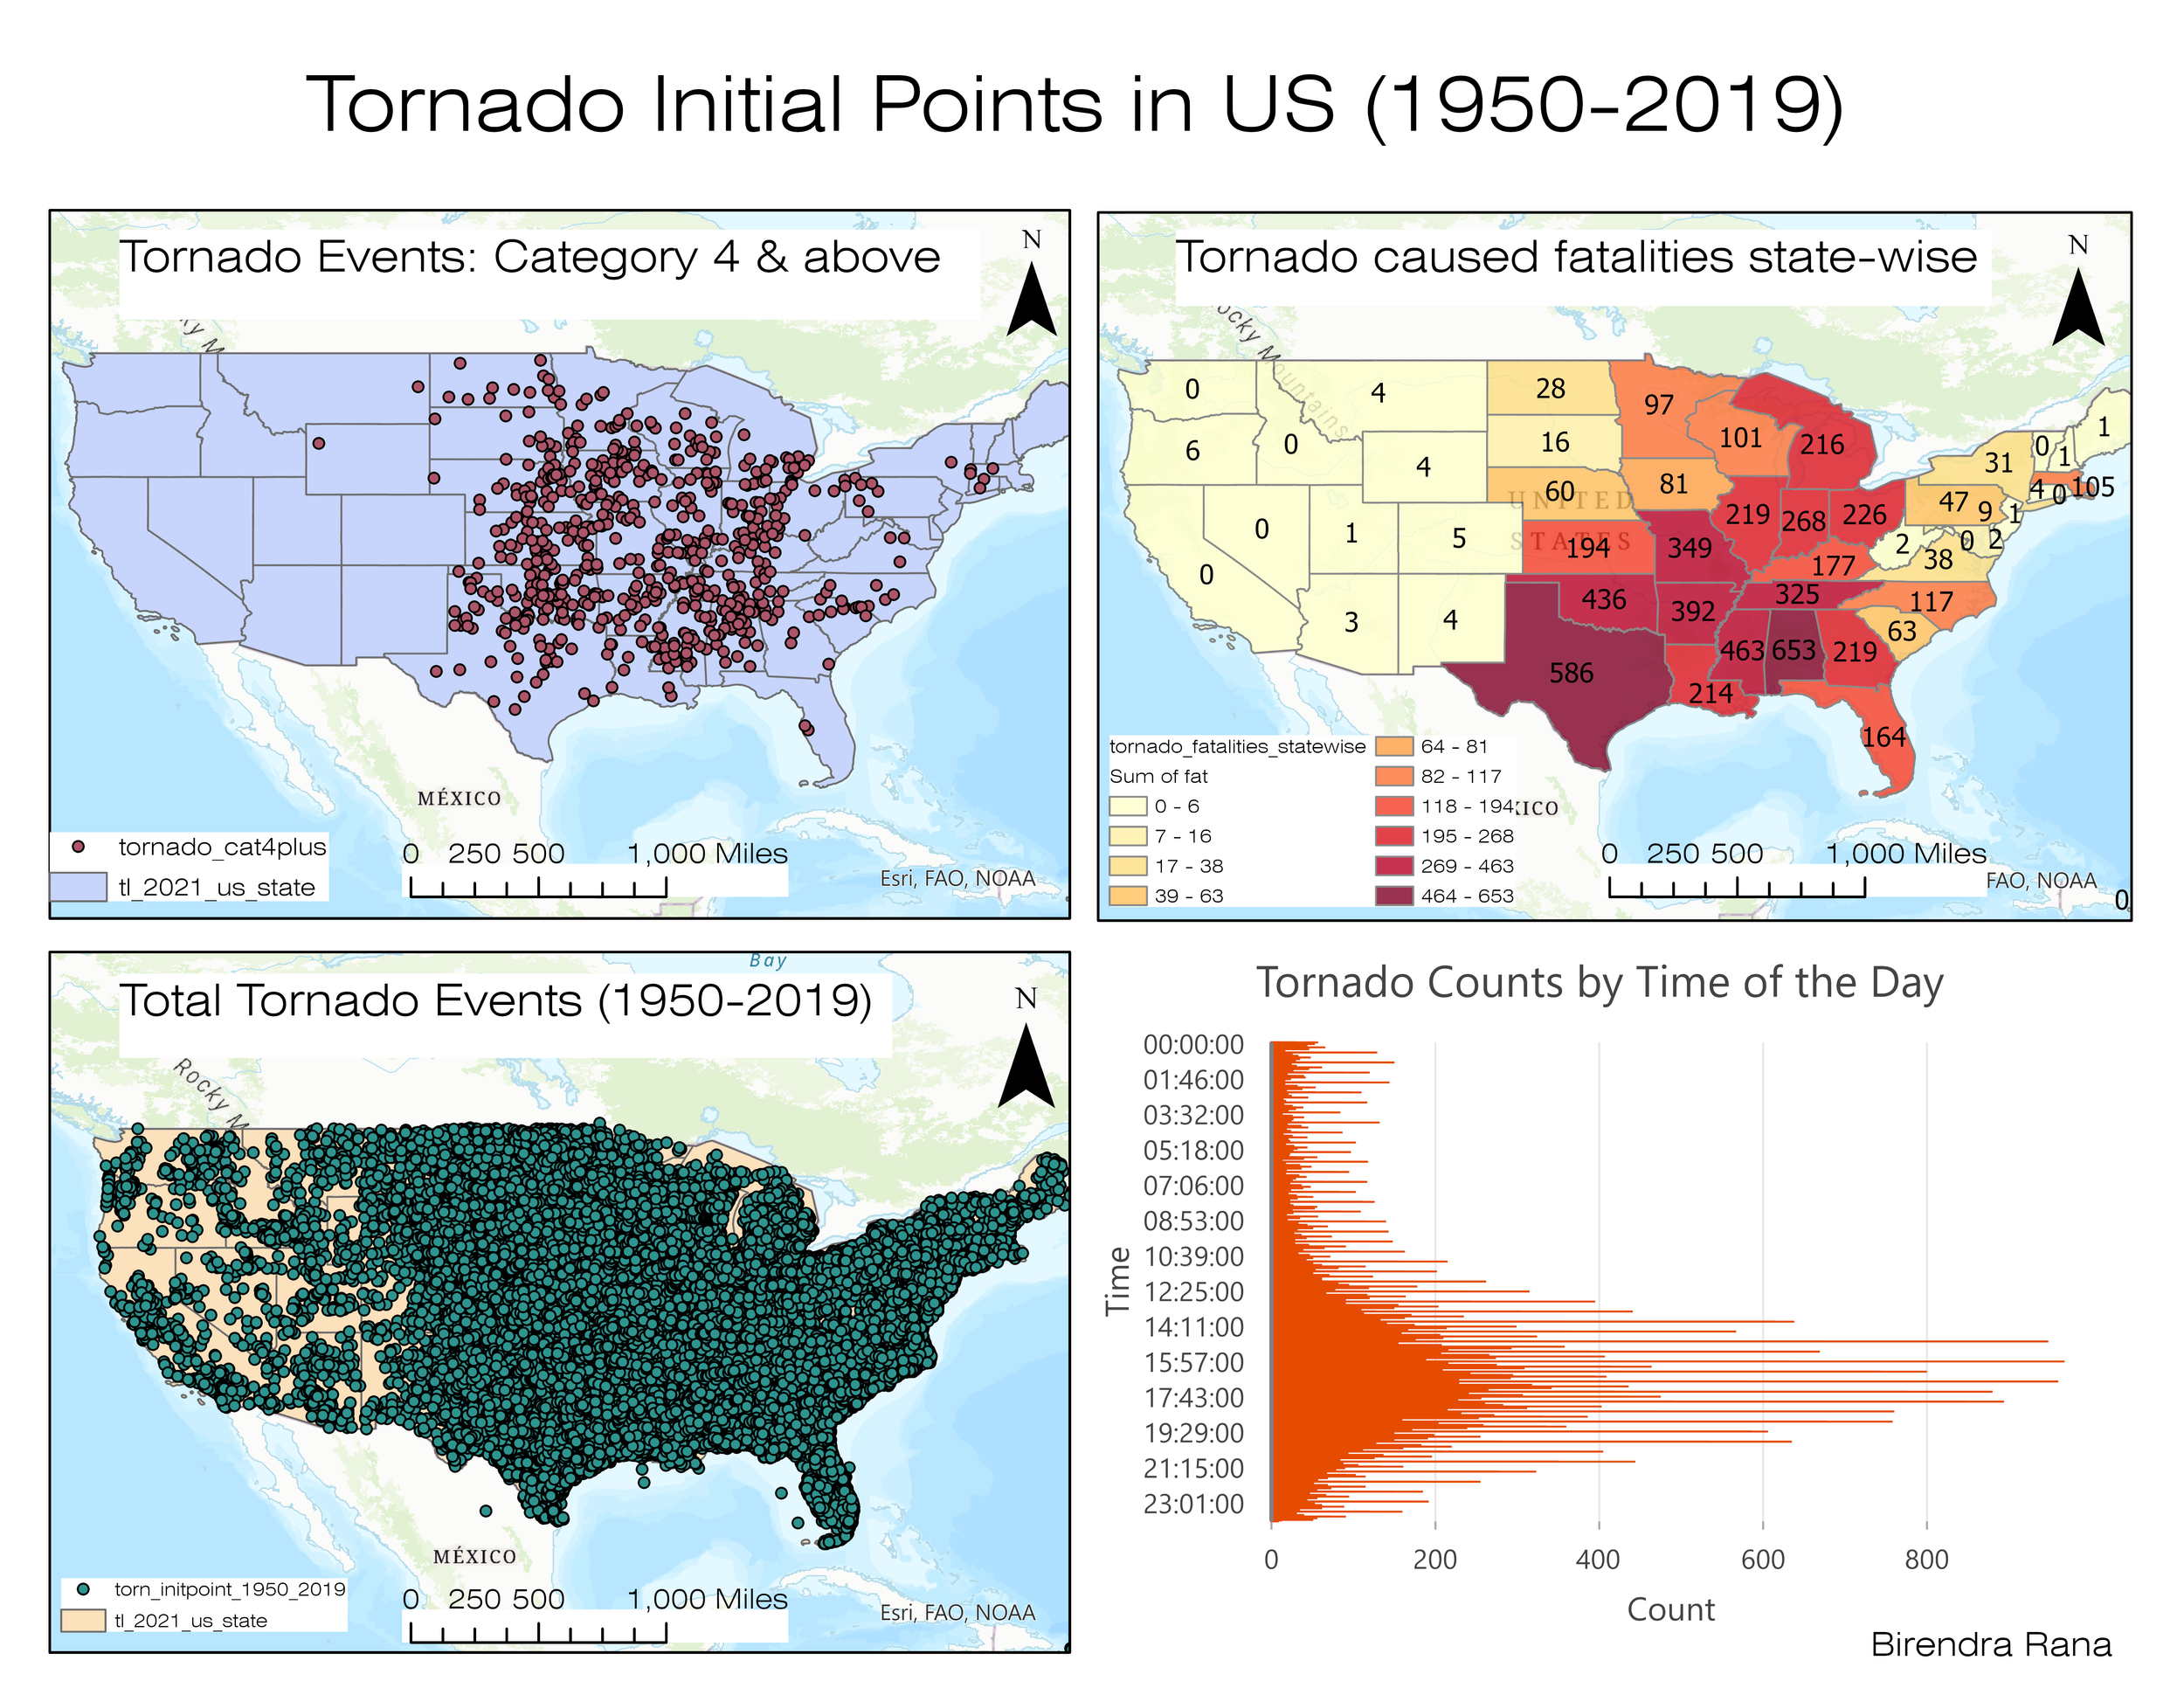
This is a spatiotemporal analysis of Tornado initial points across US states over past 70 years to examine the heterogeneity of the impact on different states and counties. I used Spatial Model Builder (ArcGIS Pro) to build an automated-tool to examine the incidence of Category 4+ Tornadoes and fatalities across states. Tornado counts by day time revealed an interesting pattern since a disproportionately higher number of incidences occurred between 2 pm to 7 pm during a day. Finally, the tornado-vulnerability index revealed that people in southern counties were exposed to disproportionately higher degree of vulnerability from such events.
5. Flood prone areas of reno, NV
Climate change and flooding in the urban environment is one of the emerging topics for spatial analysts. In Reno city, Truckee river flows right through the city parcels and any major shift in the precipitation or flow accumulation can result in flooding of the urban settlements. In this project, I use Spatial Analyst tools to examine which areas of Reno city are prone to the such an event.
I first created Reno city parcels using intersection using Washoe county parcels and Reno city limit features. Next, I created slope tif using the Digital Elevation Model (DEM) file of Reno-Sparks region that I imported from USGS Earth Explorer. Using this file I created Flow Direction and Flow Accumulation files. Finally, I used the standard parameters for flow accumulation, flow direction, and slope degrees in the Raster Calculator to find the areas prone to flood within Reno city.
6. Area calculation: Avalanche zones at Mt. rose ski resort, nv
Using Land Cover data and Digital Elevation Model for Mount Rose, this project finds the total hazardous areas for skiing at Mt Rose. We first specify the land areas at elevation above 2,100 m in South Aspect (112.5-247.5 degrees) with a slope > 30 degrees that are not forested. The total area of such restricted polygons was calculated as 7,324,200 sq. meters. Data: https://www.mrlc.gov/data
7. MODEL BUILDER: finding best cities in the US
ArcGIS Pro Model Builder helps us in building geoprocessing workflows that automate and document our spatial analysis and data management processes. In this quick demonstration, I used a geoprocessing model to be used to identify potential cities to live across the US based on cities layers, demographic data (average county income> $50K, average county population (<70K; pop density between 30 & 50), US Education > 20%), climate variables (average 30 years temperature; average rainfall between 12 & 18), Biomes (Desert, Mediterranean forests, Temperate conifer forests, Temperate mixed forests), and other socioeconomic parameters. Data Sources: MapPractical; https://prism.oregonstate.edu/; https://data.census.gov/cedsci/advanced.
ArcGIS Model Builder to automate geoprocessing workflow
8. where are the baby boomers?
ArcGIS Instant App: Map Viewer to visually analyze a public web map of baby boomer population.
This interactive map highlights the predominant generations that make up the population of the United States. As the legend shows, each generation is represented by a different colored symbol. The baby boomer generation, which is our target market, is purple. The millennial generation is teal. The color of a symbol on the map reflects the predominant generation in that area.
This app highlights the predominant generations that make up the population of the United States. The map forms the basis of an analysis of travel agency locations to determine the best one for launching luxury travel services to baby boomers.
9. economic impact of hydropower dams
One of my research areas focuses on the time-series analysis of economic impact of hydropower dams in developing countries of Global South. I used Autoregressive Distributive Lag (ARDL) model and Toda-Yamamoto Granger causality analyses (EViews 12) to examine these effects. I have published several papers on this topic in peer reviewed journals. Data: https://data.worldbank.org/country/nepal and https://www.doed.gov.np/license/54
Economic Impact of Dams in Global South
10. molung khola hydropower Project
Project Finance consultancy. It is a 7 MW capacity Run of the River project with Annual Net Energy Output of 38 GWh. It was successfully commissioned in 2019.
Molung Khola Small Hydropower Project, Okhaldhunga, Nepal
11. Siuri khola small hydropower project
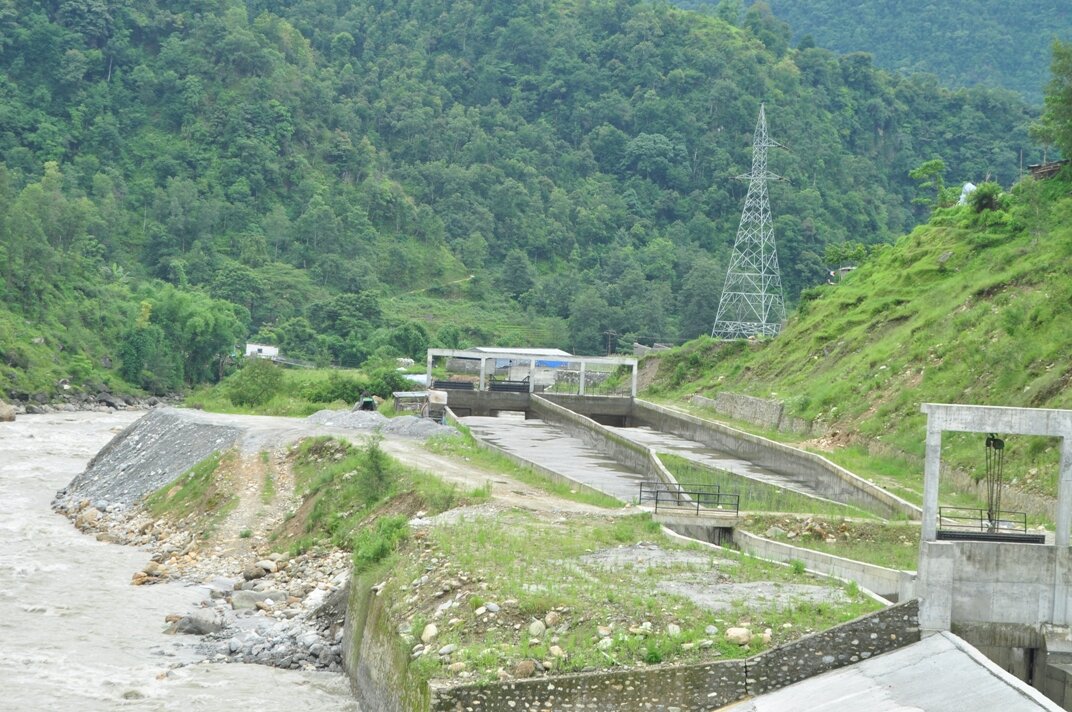
Project Finance consultancy. The project has an installed capacity of 5 MW with a design discharge of 1.4 m3/sec. Annual Energy Generation of 32.10 GWh. It is an example of technically feasible and environmentally sustainable hydropower project. The project was successfully commissioned in 2014.
Siuri Khola Small Hydropower Project, Lamjung, Nepal
12. United modi hydropower Project
Project Finance consultancy. It is a 10 MW capacity Run of the River project with Annual Net Energy Output of 61.01 GWh. It was successfully commissioned in 2012.
United Modi Hydropower Project, Parvat, Nepal
11. Upper Hugdi Small hydropower Project
Project Finance consultancy. It is a 5 MW capacity Run of the River project with Annual Net Energy Output of 28 GWh. It was successfully commissioned in 2015.
Upper Hugdi Small Hydropower Project, Gulmi, Nepal


